Builds
The EVC build system
Builds are the core unit of work on the EVC Platform. A build takes a prompt, runs it through a governed pipeline, and produces artifacts with a complete evidence trail. This guide covers everything from build modes to cost tracking.
What is a build?
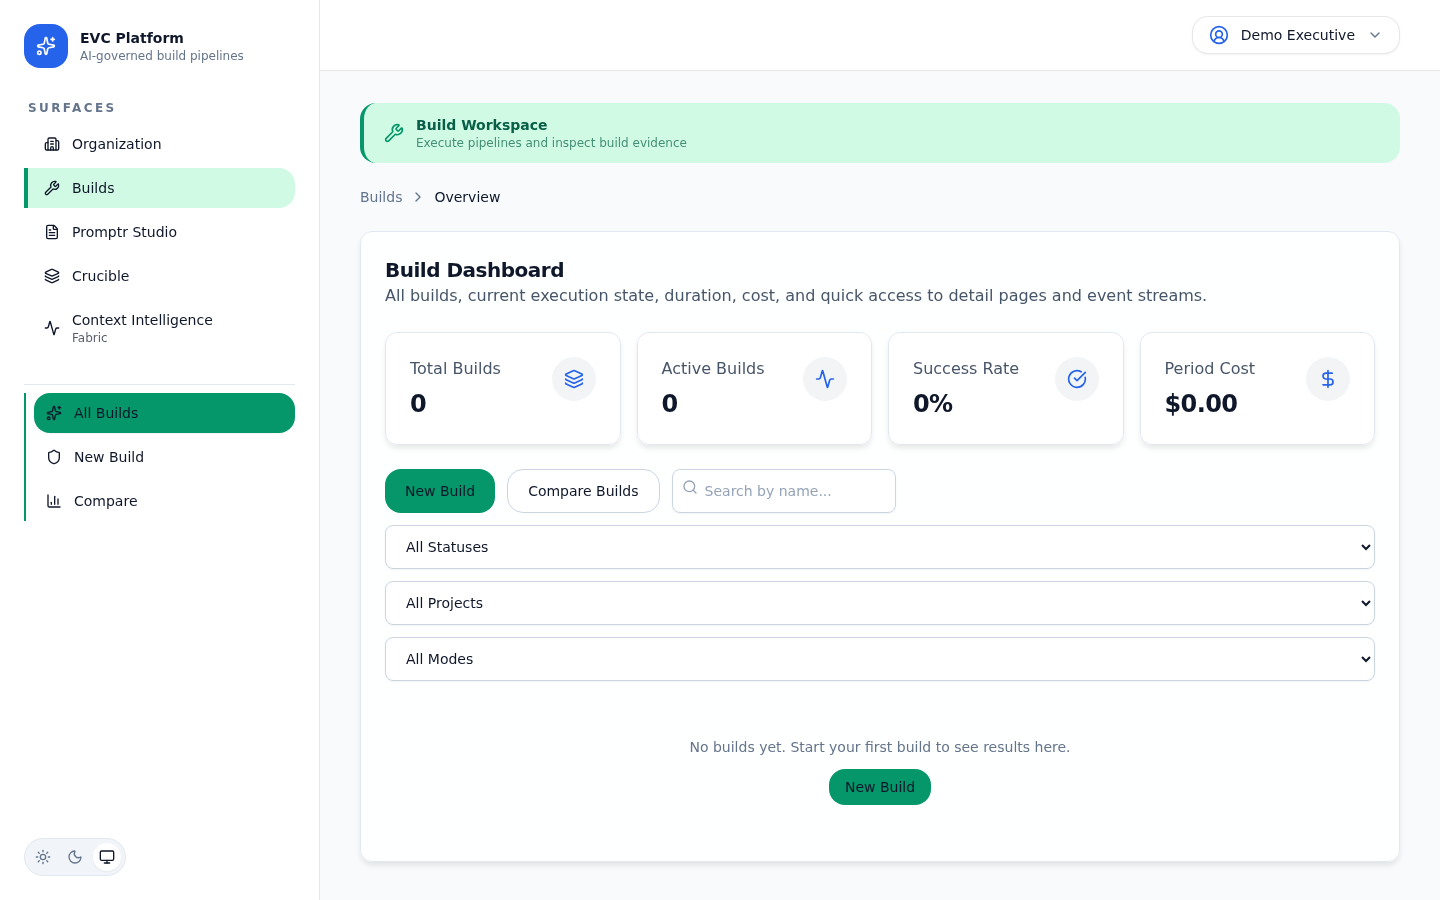
A build is a single execution of the EVC pipeline. It captures the full lifecycle from prompt submission through LLM execution, governance checks, and artifact generation. Every build produces an immutable evidence record.
When you trigger a build, the platform queues your request, allocates resources, and begins executing stages sequentially. Each stage produces events that stream to the UI in real time. When all stages complete, the build transitions to a terminal state (success or failure) and the evidence bundle is finalized.
Builds are scoped to a project within an organization. They inherit project defaults for provider, model, and mode unless overridden at trigger time.
Build modes
Build modes control the depth of governance, evidence capture, and verification applied to each execution. Choose the mode that matches your delivery requirements.
Express
Optimized for speed. Express mode skips extended governance checks and produces a lightweight evidence record. Use it for rapid iteration, prototyping, and exploratory work where full governance is not required.
Standard
Full governance pipeline with complete evidence bundles. Standard mode runs all verification stages, captures detailed telemetry, and produces artifacts suitable for review and audit. This is the recommended mode for production work.
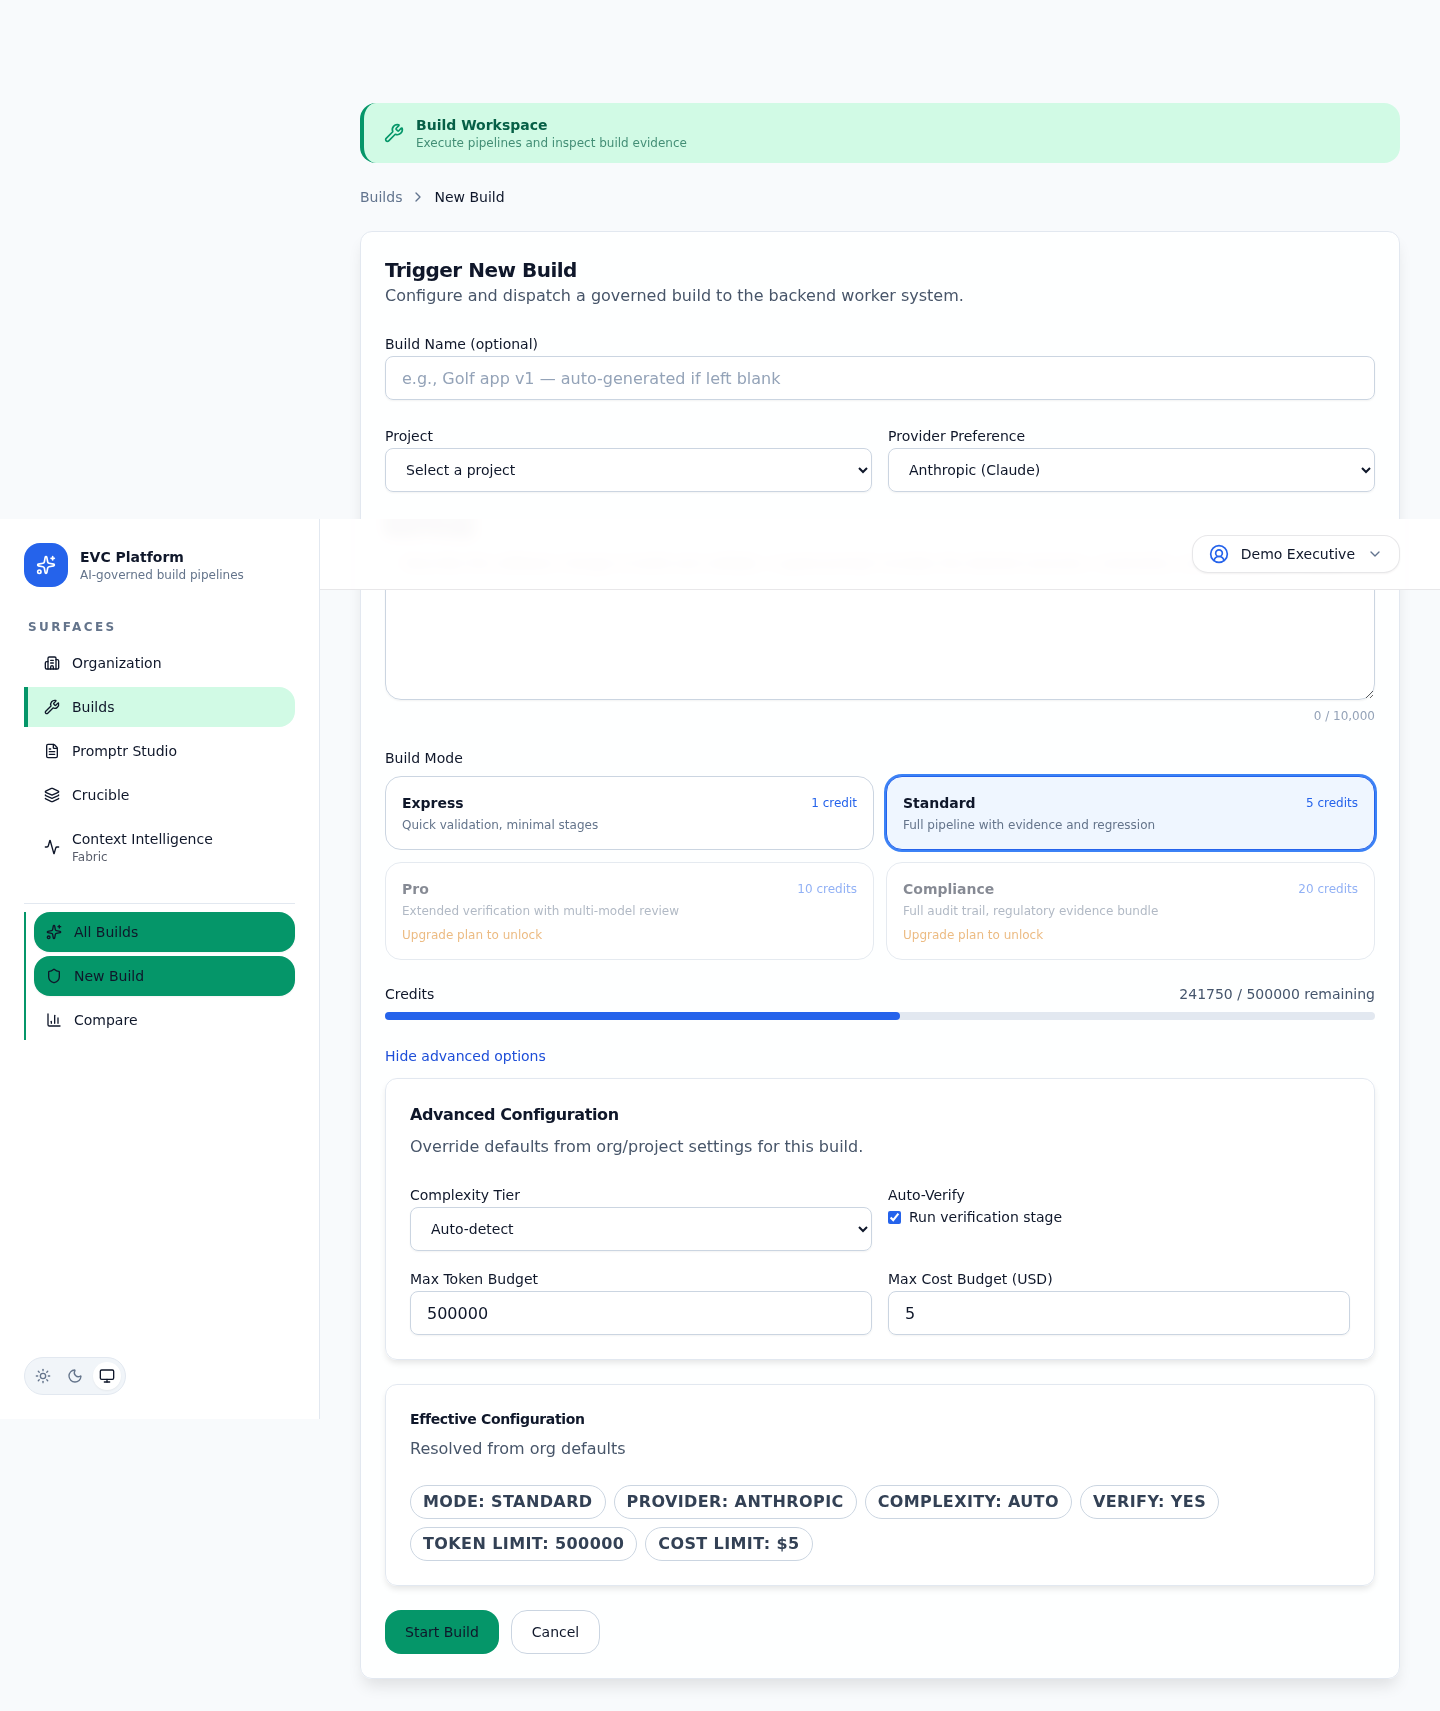
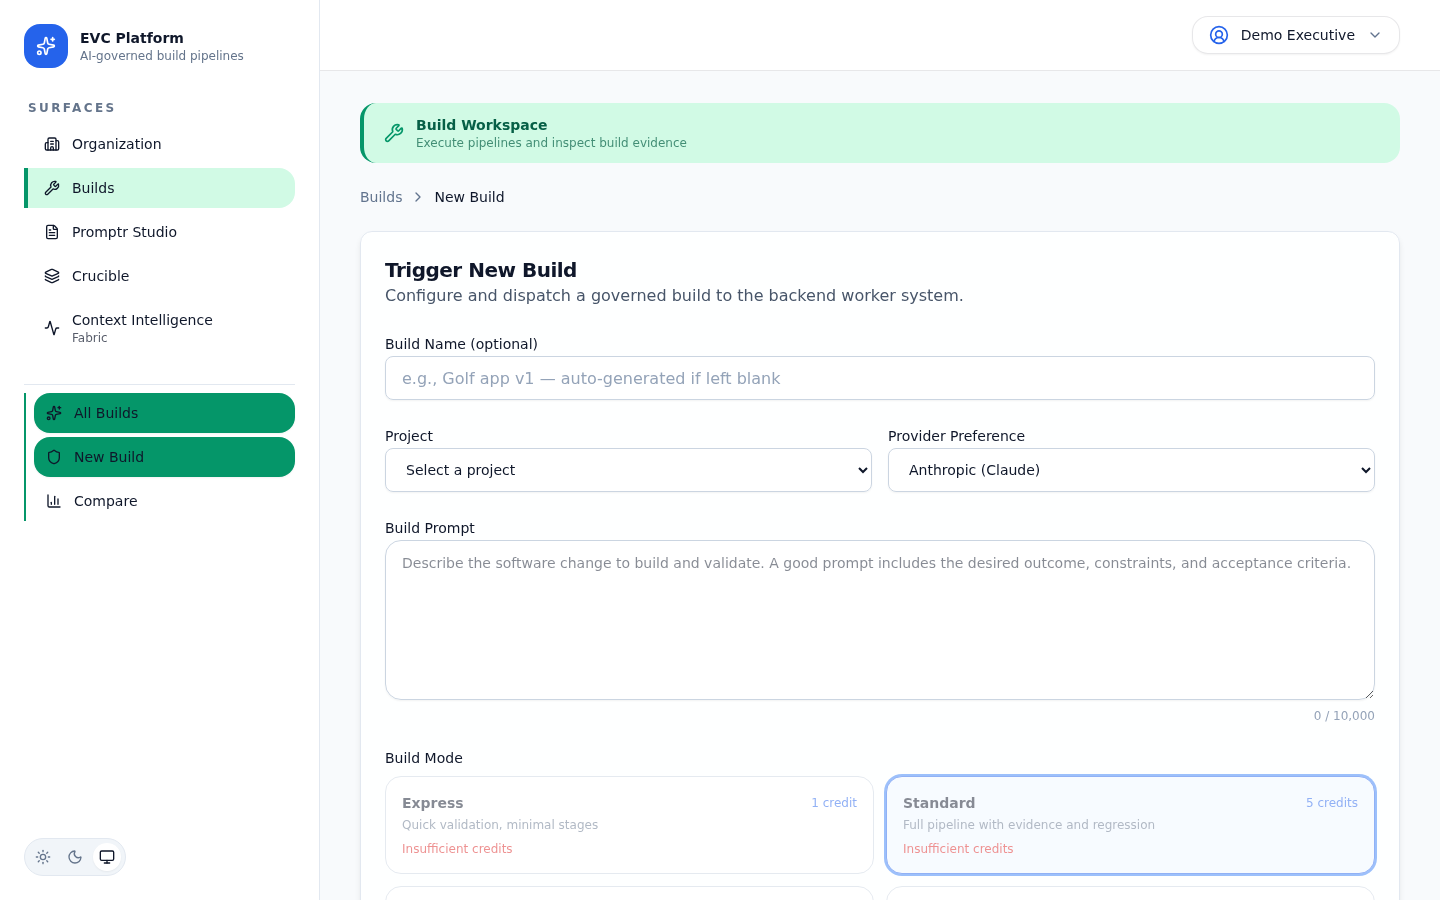
[Screenshot: Mode selector in the new build dialog showing Express and Standard options — pending capture]
Triggering a build
Builds can be triggered from the web UI or programmatically via the API. Both methods accept the same configuration parameters.
From the web UI
- Navigate to your project and click New Build.
- Select a build mode (Express or Standard).
- Write your prompt or load a saved prompt from Promptr Studio.
- Choose the LLM provider and model.
- Review the estimated cost and click Start Build.
Via the API
Send a POST request to /api/v1/orgs/:orgId/builds with a JSON body specifying the project, prompt, provider, model, and mode. See the API Reference for full request and response schemas.
[Screenshot: API trigger example in the interactive Swagger documentation — pending capture]
Build events and real-time streaming
As a build executes, the platform emits events for every stage transition, LLM call, governance check, and artifact generation. Events stream to the web UI in real time via Server-Sent Events.
The event stream shows each stage as it starts and completes, along with intermediate output, token counts, and timing data. Events are persisted and remain available after the build finishes, so you can replay the execution timeline at any time.
[Screenshot: Live event stream during an active build showing stage transitions — pending capture]
Key event types include stage.started, stage.completed, llm.call.started, llm.call.completed, artifact.generated, and build.completed.
/api/v1/builds/:buildId/events for the same real-time stream.Build artifacts and evidence
Every build produces two categories of output: artifacts (the generated deliverables) and evidence (the governance record that proves how artifacts were produced).
Artifacts
Artifacts are the files generated by the build: code, documents, configurations, or any other deliverable specified by the prompt. They are stored immutably and linked to the build record.
[Screenshot: Artifacts tab showing file list with type, size, and download actions — pending capture]
Evidence bundles
Evidence bundles capture the complete execution record: the original prompt, configuration, every LLM call with input/output, stage telemetry, governance check results, and timing data. This record is immutable and context-independent, meaning any reviewer can verify the build outcome without access to the implementation conversation.
[Screenshot: Evidence bundle viewer showing governance outcomes and stage details — pending capture]
Build comparison
Compare two builds side by side to understand differences in output quality, cost, timing, and governance outcomes. Build comparison helps teams evaluate prompt changes, mode differences, and provider performance.
- Select two builds from the project build list using the comparison checkboxes.
- Click Compare to open the side-by-side view.
- Review differences in artifacts, cost, timing, and governance outcomes.
[Screenshot: Build comparison view with side-by-side artifacts and metrics — pending capture]
Cost and token tracking
Every build tracks token usage and credit cost at the stage level. The platform breaks down input tokens, output tokens, and total cost per LLM call so teams can optimize prompt efficiency and provider selection.
The build detail page shows a cost summary at the top and a per-stage token breakdown in the timeline. Token counts are reported by the LLM provider and recorded without modification.
[Screenshot: Build cost summary showing total credits, token breakdown, and per-stage costs — pending capture]
For organization-wide cost analysis, see the Intelligence (CIF) documentation for budget enforcement and provider comparison tools.
[Screenshot: Token breakdown chart showing input vs output tokens per stage — pending capture]